Explore mode
(Power Viewers only)
Explore mode provides additional capabilities
for data investigation beyond those available in view mode. Users can
change the analysis type, group the data by another attribute (any available
in the dataset), add measures besides those that were built into the dashboard,
and more. Explore mode does not allow users to build and format complex
dashboards. Administrators
can turn off this capability.
To
start exploring from a widget |
When viewing a dashboard, you
can expand any of its widgets in explore mode to dig deeper into
the data.
Click  in the upper-right corner
of a widget (visible on mouseover) to open the menu. in the upper-right corner
of a widget (visible on mouseover) to open the menu.
Select Explore From Here. |

|
The widget is maximized within its own tab in
explore mode. Additional options to investigate the data (see below) are
available in the toolkit on the left side of the screen.

Go straight to explore mode |
|
If you prefer, you can start exploring from
a default view rather than picking a widget |

|
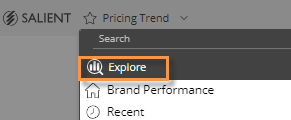
In the dashboards screen, open
the dashboards menu and select Explore.
The default starting point is a simple comparative, unless your
organization has customized its own starting point. |
What you can do in explore mode
Explore mode offers the same options for interacting
with the data that are available in view mode plus the following:
When you are finished exploring
When you are done exploring, you can:
Use the browser's back button to go back to your previous
dashboard/mode.
Save your changes
in a new dashboard. The resulting dashboard will use the same formatting
as explore mode (i.e., maximized widgets in a tabs).
 in the upper-right corner
of a widget (visible on mouseover) to open the menu.

