- in explore mode (Power Viewers only)
You can add measures or "data fields" to data widgets using the measures area of the toolkit (located under Context).
To add measures

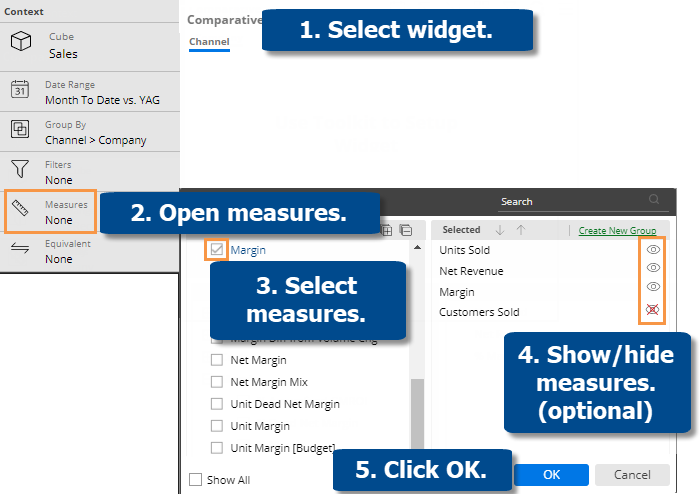
Select widget - Click on the widget if it's not already selected.
Open measures - In the Toolkit panel, expand the Context area and click on Measures.
Select measures - Under Available, click the row(s) or box(es) of the measure(s) to show. The selected measures appear in the right pane. The number of allowed measures depends on the widget type.
Optionally, hide  all measures
except those that you want to show.
Click OK.
Tips: |
|
By default, the available measures depend on the context (data cube, By, etc.). You can check the Show All link at the bottom of the dialog to see all measures regardless of the context. Measures may also be limited by the analysis type. |
|
The tools in the right pane of the dialog allow you to search for a measure, remove a measure, rearrange measures, rename a measure (display name only), and show/hide measures. In addition, you can create measure groups to help organize measures if you wish.
|
|
In a key list (e.g., customer list), you can add descriptions (e.g.,name, address, channel, etc.) and dimensions (e.g., region, sales rep, etc.) in addition to measures.
|
|
For Share Trend widgets, you cannot add multiple measures unless you check the Enable Multiple Measures box at the bottom of the dialog. In this case, you will be able to add multiple measures to allow selection in view mode; however, the widget will still only display one measure at a time. |
|
Measures that are associated with dimensions, such as budgets, are only available if the "Group By" matches that dimension. |
|
If the dataset has currency tables, you can change the currency in user preferences. |
|
If a grid already has the measure, but is missing a This or Last subcolumn, you can click on the measure column heading and select from a menu to add the subcolumn. |
|