Comparative Overview
Description
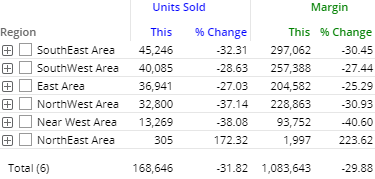
Comparison of members for one or two date ranges; any number of measures
Examples
Date setup
This widget shows results for one or two date ranges. Click on  in the widget toolbar (visible on mouseover
if enabled) and select from pre-configured or custom options
for "This" date range. Optionally,
choose an earlier date range (Last) for comparison.
in the widget toolbar (visible on mouseover
if enabled) and select from pre-configured or custom options
for "This" date range. Optionally,
choose an earlier date range (Last) for comparison.
Measure setup
The widget can show any number of measures.
To show/hide measures, click  in the widget toolbar (visible
on mouseover; Power Viewers only).
Only measures that
have been added to the widget will be available for selection using this
tool.
in the widget toolbar (visible
on mouseover; Power Viewers only).
Only measures that
have been added to the widget will be available for selection using this
tool.
To add measure(s), click the Measures area of the toolkit (in explore mode; Power Viewers only).

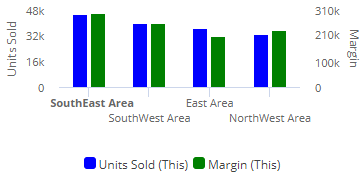
Graphs are limited to the measures that use the "Show on graph" setting. This setting is on for all measures by default, but can be turned on/off for any measure.
Group By
This analysis compares members of the Group By.
Formats