To insert budgets
Make sure the analysis meets the criteria for showing budgets explained below.
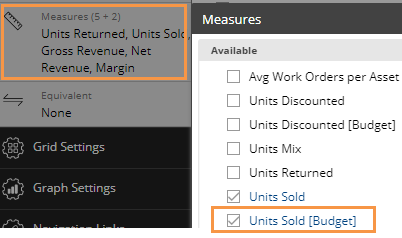
Insert the budget measure using the Measures area of the toolkit.
The insert menu shows the name of the budget cube (e.g., Budget) in brackets.
- in explore mode (Power Viewers only)
You can display budget data in most types of analyses. In general, grids and graphs treat budget data just like other measures. For example, you can add it to a grid to compare it with actual values.
To insert budgets |
|
The insert menu shows the name of the budget cube (e.g., Budget) in brackets. |
|
Criteria for showing budgets
The units of time (resolution) must be the same as those for which budgets are available.
The selected date range must have budget data.
The dataset must have budgeted goals for the dimension used to group the data. For example, when you look at data grouped by city, you can only insert budgeted goals if they have been defined for the City dimension.
The widget type must allow the insertion of budgeted goals. For example, you cannot insert budgets into an Exception analysis. You typically cannot insert budgets into a key list unless budgets are specified for each individual key member.
Tips: |
|
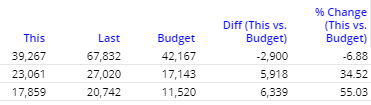
Comparative and Trend grids |
You can display budget values side-by-side with actual values. In Comparative grids you can also display the difference and percent change between actual values and budget values (if the measure and the budgets are joined in the dataset configuration).
|
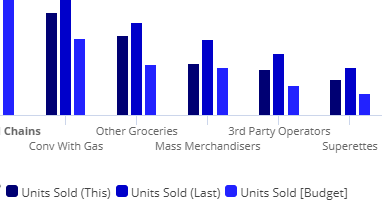
Comparative graphs |
If the setup includes actual values and budgeted goals that are joined, then the graph shows percent change for This versus Last and versus budgets, or actual values for This, Last, and budgets, depending on the graph format.
|