Share Trend Overview
Description
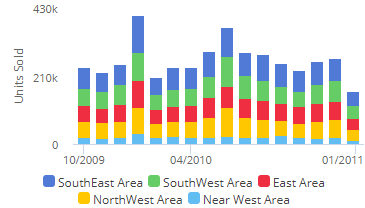
Comparison trend for multiple members; either actual values or percent of the total for single measure
Example
Date setup
This analysis shows data for each date (day, week, month, etc.) in the
date range(s). Click on  in the widget toolbar (visible
on mouseover if enabled)
and select from pre-configured or custom options.
in the widget toolbar (visible
on mouseover if enabled)
and select from pre-configured or custom options.
Measure setup
This widget only shows one measure at a time; however, if the widget has multiple measures; users can select which of these to show (if enabled; Power Viewers only).
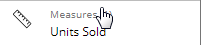
In explore mode (Power Viewers only), you can add measure(s) by clicking the Measures area of the toolkit.
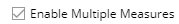
To add multiple measures, check the Enable Multiple Measures box at the bottom of the measures areas.
Group By
This analysis compares members of the Group By.
Formats