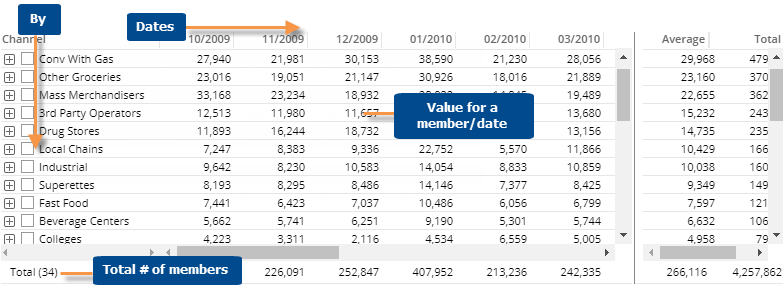
The Share Trend grid shows data for each member of the "Group By" attribute for each day, week, month, or period in the date range.
Actual Value
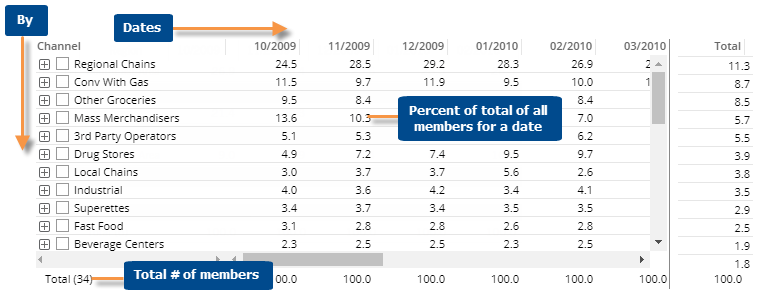
Percent
Share Trend grid options |
Explanation |
Actual Value or Percent |
Click |
Open Comparative for date |
You can click on a date heading to open a Comparative widget for that date.
For this option to be available in view mode, the allow spawning option must be on in dashboard settings. |
Expand members |
You can click |
Total and average rows |
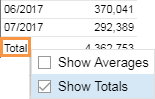
To show or hide a total row and/or average row, click on the Total/Average row in the grid. These rows show totals or averages across all dates in the date range and are calculated differently depending on the type and meaning of the data.
|
Highlight data |
In explore mode, you can highlight data in the grid. To access highlight settings, place your cursor over a column heading, click the drop-down arrow, and select Highlighting from the menu. |
In grid settings (in explore mode): |
|
- Swapped and scorecard formats |
The standard grid shows dates columns and members in rows. You can swap columns and rows in the grid types area under grid settings. |
- Grid page size |
In grid settings, you can choose how many members of each dimension to show at once. For the 1st By, this setting controls the maximum number of members on each page. For expanded data (e.g., 2nd By), members over this number will be truncated. Because an expanded grid includes multiple dimensions, the total number of rows may exceed the grid page size. |
 in the upper-right corner to choose between a graph of actual
values or percent of the total (i.e. mix). See the previous examples.
The percent option does not allow graphing of measures
calculated with multiplication or division.
in the upper-right corner to choose between a graph of actual
values or percent of the total (i.e. mix). See the previous examples.
The percent option does not allow graphing of measures
calculated with multiplication or division.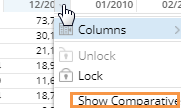
 to expand a member into the 2nd
By if one has been defined.
to expand a member into the 2nd
By if one has been defined.