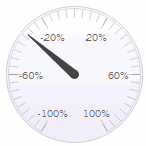
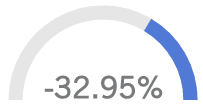
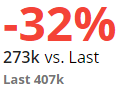
Gauge Overview
Description
A simple visual tool showing performance; single measure
Examples
Date setup
This widget shows results for one or two date ranges. Click on  in the widget toolbar (visible on mouseover
if enabled) and select from pre-configured or custom options
for "This" date range. Optionally,
choose an earlier date range (Last) for comparison.
in the widget toolbar (visible on mouseover
if enabled) and select from pre-configured or custom options
for "This" date range. Optionally,
choose an earlier date range (Last) for comparison.
Measure setup
The graphical
gauges (horizontal, circle, numeric, etc.) show one measure at a time. The grid format can show any
number of measures.
To select the measures to show/hide,
click  in the widget toolbar (visible on mouseover;
Power Viewers only). Only measures
that have been added to the widget will be available for selection
using this tool.
in the widget toolbar (visible on mouseover;
Power Viewers only). Only measures
that have been added to the widget will be available for selection
using this tool.
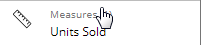
To add measure(s), click the Measures area of the toolkit (in explore mode; Power Viewers only).
Filter By
This widget aggregates data for all members unless a filter is applied.
Formats
Circle graph (regular gauge or solid)