To add reference lines
Go to Visual Options by clicking
 in the graph
legend (visible on mouseover).
in the graph
legend (visible on mouseover).Click the Custom Reference Line button.
Select from the available settings, depending on what you want the reference line to show.
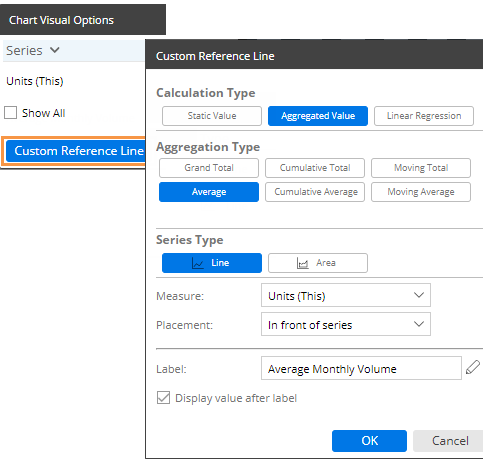
You can add custom lines to enhance data visualizations. Custom lines can show thresholds, important dates, and calculated values such as averages, totals, moving averages/totals, cumulative values, and projections.
To add reference lines |
|
|
|
Reference line examples |
Recommended settings |
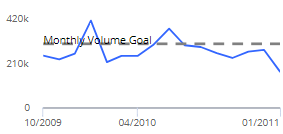
Compare values to a fixed, user-defined threshold: Over time in time-series:
|
Calculation Type - Static Value Series Type - Line for a single value, or Area for a range between two values Measure - Select the measure/format where you want to place the reference line. Axis - Y Value or From/To - Enter a static value. For a shaded area, enter the start value and the end value. Placement - Place the reference line in front or behind the data. Label - Optionally, enter a label for the line. Display value after label - Check the box if you want to include a label showing the value of the line. |
Compare values to a fixed, user-defined threshold: Across members in comparative:
|
Calculation Type - Static Value Series Type - Line for a single line, Area for a range between two values, or Column for a separate column at the end of the graph Measure - Select the measure/format where you want to place the reference line. Y Value or From/To - Enter a static value. For a shaded area, enter the start value and the end value. Placement - Place the reference line in front or behind the data. Label - Optionally, enter a label for the line. Display value after label - Check the box if you want to include a label showing the value of the line. |
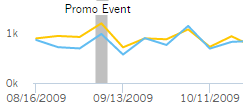
Important dates on a time-series
|
Calculation Type - Static Value Series Type - Select Line for a single date or Area for a range of dates. Measure - This setting is ignored. Axis - X Value - Click the date control(s) and select a single date (for Line) or the beginning and ending dates (for Area). Placement - Select to place the reference line in front or behind the data. Label - Optionally, enter a label for the line. Display value after label - Check the box if you want to include a label showing the value of the line. |
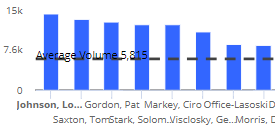
Calculated average or total over multiple members (e.g., average volume per sales rep)
|
Calculation Type - Aggregated Value Aggregation Type - Grand Total of all members, or Average of all members Series Type - Line for a line indicating the average/total, Area for a solid area starting at zero and going to the average/total, or Column for a separate column at the end of the graph. Measure - Select the measure/format for which to calculate averages or totals. Placement - Select to place the reference line in front or behind the data. Label - Optionally, enter a label for the line. Display value after label - Check the box if you want to include a label showing the value of the line. |
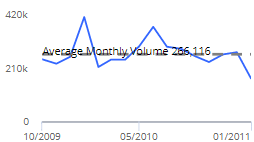
Calculated average across dates (e.g., average volume per month)
|
Calculation Type - Aggregated Value Aggregation Type - Average Series Type - Line for a single line indicating the average, or Area for a solid area starting at zero and going to the average. Measure - Select the measure/format for which to calculate averages or totals. Placement - Select to place the reference line in front or behind the data. Label - Optionally, enter a label for the line. Display value after label - Check the box if you want to include a label showing the value of the line. |
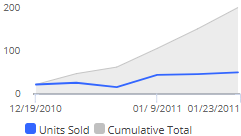
Cumulative average or total over date range (e.g., cumulative volume over time); see cumulative examples
|
Calculation Type - Aggregated Value Aggregation Type - Cumulative Average or Cumulative Total Series Type - Line, Area, or Columns Measure - Select the measure/format for which to calculate averages or totals. Label - Optionally, enter a label. |
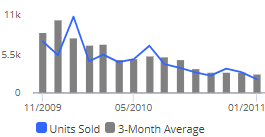
Moving averages or totals for a set number of prior dates; smooths data fluctuations; see moving examples
|
Calculation Type - Aggregated Value Aggregation Type - Moving Average or Moving Total Series Type - Line, Area, or Columns Measure - Select the measure/format for which to calculate averages or totals. Duration - Select the number of prior dates to include in the calculation. Label - Optionally, enter a label. |
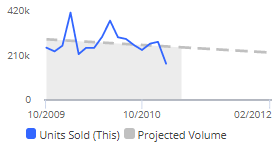
Calculated trends with future projections
|
Calculation Type - Linear Regression Series Type - Select Line or Area. Measure - Select the measure/format for which to calculate projections. Projection Duration - Select the number of future dates for which to project data based on a linear regression. The resulting graph will show the selected date range plus the selected number of projected dates. Placement - Select to place the reference line in front or behind the data. Label - Optionally, enter a label. |