Salient Dashboards enables your team to create and access interactive, consolidated visualizations of decision support intelligence in a browser for consumption from any computer or mobile device.
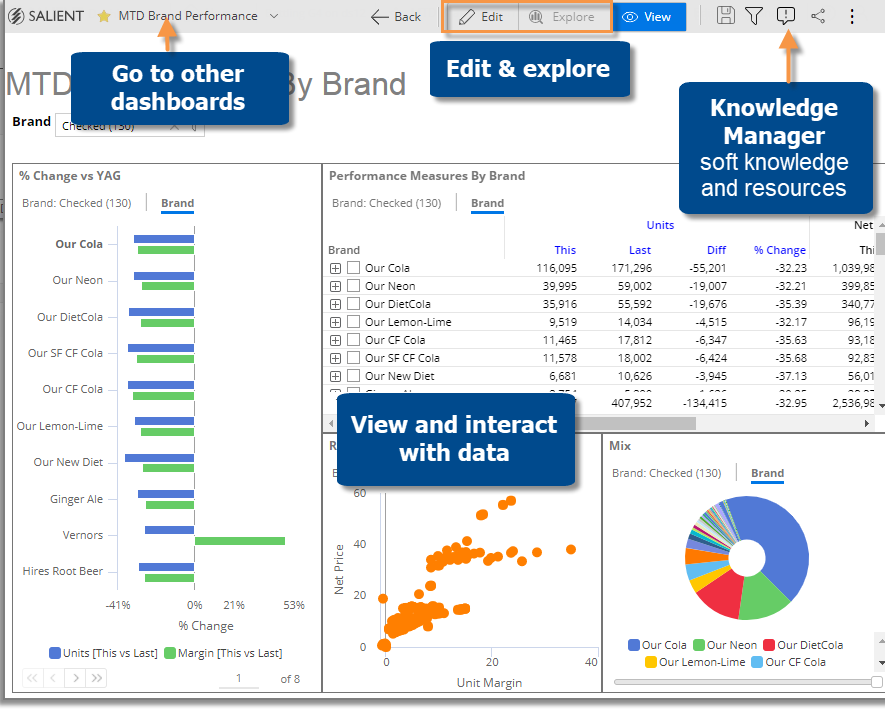
Like Salient's other applications, dashboards start with UXT® technology, which transforms huge volumes of data into a highly-optimized analytical data mart. Salient Dashboards provides role-based access to dashboard building, viewing, and exploring capabilities. Dashboard Designers can create and publish dashboards in "edit" mode using a variety of widget types (Comparative, Trend, Scattergram, etc.) and options to provide the exact information users need—from an overview of the entire organization down to a single fact. Users can then view and interact with the customized dashboards. Power Viewers and Dashboard Designers can go on to perform their own data investigation in "explore" mode. Portal dashboards provide easy access to dashboards. In addition, a mobile application is available to provide access on mobile devices. For additional capabilities, you may want to install and use Salient's advanced analytical workstation, Salient Interactive Miner™ (SIM).
About Power Viewer
Power Viewer is an enhanced licensing option that provides the following capabilities beyond basic dashboard viewing.
Advanced capabilities in view mode for Power Viewers:
Select measures using the measure selection tool (i.e. show/hide). (Multiple measures must be pre-configured and measure changing must be enabled for the widget.)
Use the breadcrumb path to select the By and, therefore, follow a flexible drill path. (Multiple Group Bys must be pre-configured and the breadcrumb path must be enabled for the widget.)
Use advanced date options such as fixed or moving timeframes and offset time periods. (The date icon must be enabled for the widget.)
Access setup options for Geo.
Change display names of measures and measure families in Trend, Comparative, and Multi Comparative graphs (actual value only).
Save dashboards (as private and/or published depending on user account settings).
Turn on and create collections (private and/or global depending on user account settings).
Further investigation in explore mode:
Power Viewers have access to explore mode where they can expand a widget to further investigate the data. Explore mode allows users to change the analysis type, add measures beyond those built into the dashboard, group the data by any available attribute, and more. Note that explore mode may be disabled.