 (visible on mouseover)
to change from grid
to graph or
(visible on mouseover)
to change from grid
to graph or  to change from graph to grid of numbers. (This button
may be deactivated.)
to change from graph to grid of numbers. (This button
may be deactivated.)
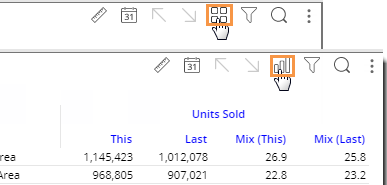
Various grid and graph formats are available for each analysis type.
To toggle between a grid and a graph
On the title bar of the widget, click (visible on mouseover)
to change from grid
to graph or to change from graph to grid of numbers. (This button
may be deactivated.)
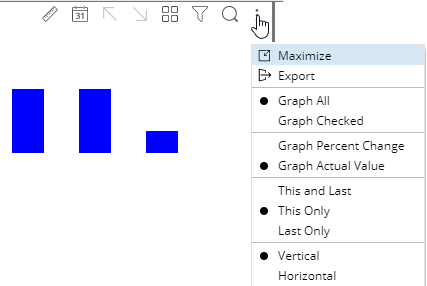
To select a graph format
For graphs, click  in the upper-right corner of
the widget (visible on mouseover) to select from available graph formats
for the analysis type (e.g. percent change, actual value, bar, pie, etc.).
in the upper-right corner of
the widget (visible on mouseover) to select from available graph formats
for the analysis type (e.g. percent change, actual value, bar, pie, etc.).
Tip: If the widget uses custom programming (i.e., custom view), the graph/grid button is not available.