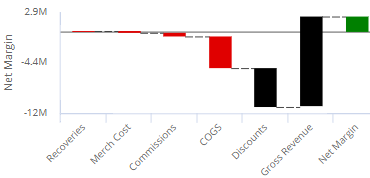
Waterfall Overview
Description
How the components of a calculated measure affect its make-up
Examples
Date setup
This widget shows results for one or two date ranges. Click on  in the widget toolbar (visible on mouseover
if enabled) and select from pre-configured or custom options
for "This" date range. Optionally,
choose an earlier date range (Last) for comparison.
in the widget toolbar (visible on mouseover
if enabled) and select from pre-configured or custom options
for "This" date range. Optionally,
choose an earlier date range (Last) for comparison.
Filter By
This widget aggregates data for all members unless a filter is applied.
Measure setup
This widget shows a calculated measure and each of its components. You can add a single calculated measure by clicking the Measures area of the toolkit (explore mode; Power Viewers only).
Formats