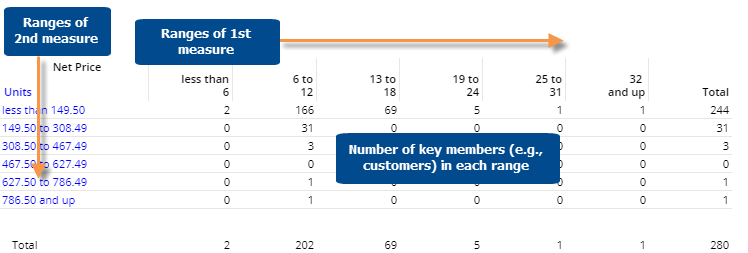
This grid counts the key members that fall into ranges for two measures.
Scattergram grid options |
Explanation |
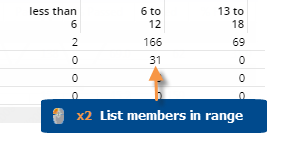
List key members in range |
You can double-click on a number in order to list the selected key members in a pop-up window.
For the pop-up window capability to be available in view mode, the "allow spawning" option must be on in dashboard settings. |
In settings (in explore mode): |
|
Include Nulls |
By default, the Scattergram shows only the key members with data for the selected date range; in other words, it removes null key members. You can include the key members without data by turning on Include Nulls in general settings. |
Heading colors |
By default, the heading colors represent the measure categories (e.g., blue for volume); you can turn off the colors in dashboard settings if you wish to simplify the grid. |