Salient Dashboards can show record-level data (e.g. invoices, work records, inventory, etc.) in a graph or grid. To see data at this level, group the data by "Record Details." The details show each individual record for the given context. Record details may include dates (single date for transactions or start/end dates for non-transactional data), measures, key descriptions, dimensions, and invoice numbers (if configured).
Record details may be used as the primary way of viewing the data (i.e., 1st By) or further down in the hierarchy to allow flexible drilling into record details. The details may be filtered like other views to show any subset of data records.

(Record Details must be preconfigured into the dashboard as a Group By to allow access in view mode.) |
|
Option 1 (Power Viewers only) Click in the breadcrumb path to change the Group By. Choose Record Details. |
|
Option 2 Drill down until you arrive at record details for the selected context. |
|
Tips: |
|
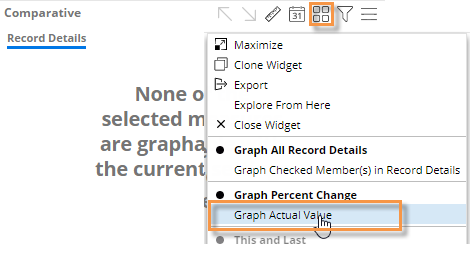
If you see a message that none of the selected measures are graphable, make sure that you are not in a Percent Change graph. This graph type does not support record details. Instead, switch to a grid or an Actual Value graph. |
 |
Records details are limited to one million records. If records exceed this limit, reduce the amount of data using filters or by changing the date range. |
|
Record details provide information similar to SIM's Line Item analysis (for transactional data) and Time in Place analysis (for non-transaction data). |
|