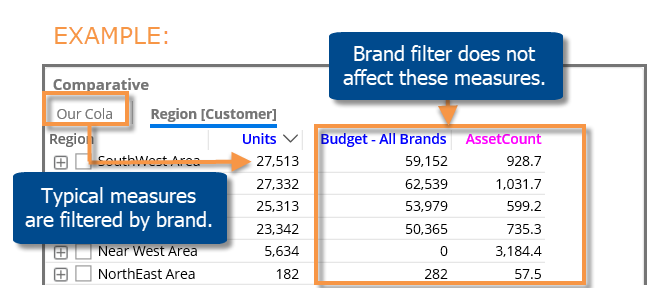
By default, Salient Dashboards hides measures based on applied filters to prevent information that may be potentially misleading (i.e. misinformation). In general settings, you can turn on misinformation to override measure visibility rules and show this type of data. For example, you might want to show budgets or asset counts even if an applied filter does not affect those values.

To allow misinformation
Go to general settings for the widget.
Check the Misinformation box. Only advanced users who fully understand the dataset schema should utilize this option. Administrators may turn this option off entirely.
In analyses that group the data by an attribute (e.g., comparative and share trend), measures should now be visible regardless of applied filters. Note that measures are still filtered based on how the data is grouped. For Crosstab analyses, the 1st By and the Cross By filter the available data regardless of the Misinformation setting.
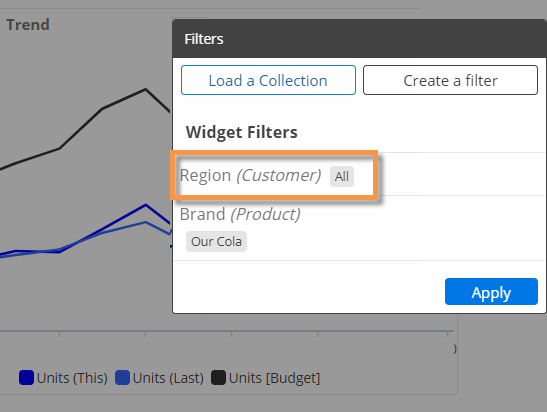
In analyses that do not have a group by (e.g., trend), the following additional setup is required to turn on misinformation:
|
|
|
 |