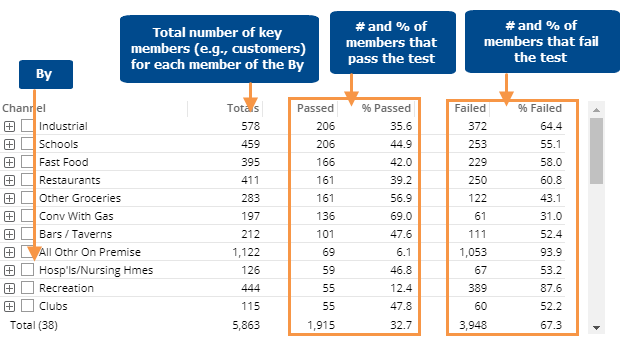
The Exception grid shows the number and percent of passing and failing key members (e.g., customers) in each member of the By. The numbers are based on an exception test. If you compare two date ranges, the grid includes This and Last and may also show difference and percent change.
Exception grid options |
Explanation |
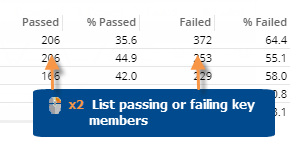
List passing/failing members |
You can double-click to list passing or failing key members (e.g., customers).
|
Expand members |
You can click (The 2nd By cannot be a "list" for this option.) |
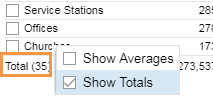
Total and average rows |
To show or hide a total row and/or average row, click on the Total/Average row in the grid. These rows show totals or averages for all members in the context—not just the current page.
|
In grid settings (in explore mode): |
|
Grid page size
|
In grid settings, you can choose how many members of each dimension to show at once. For the 1st By, this setting controls the maximum number of members on each page. For expanded data (e.g., 2nd By), members over this number will be truncated. Because an expanded grid includes multiple dimensions, the total number of rows may exceed the grid page size. |
 to expand a member into the 2nd
By if one has been defined.
to expand a member into the 2nd
By if one has been defined.