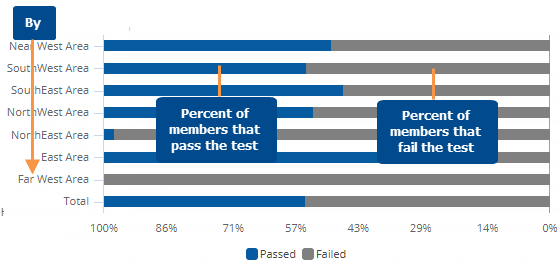
This graph shows the percent of key members that pass or fail the exception test within each By member. If the graph compares two date ranges, a second set of bars show Last date range.
Exception graph options (in explore mode) |
|
# of members/page |
In graph settings, set the Graph Page Size equal to the maximum number of members to show on one page. If the context has more 1st By members than the selected
page size, then you can use the arrows If the widget size does not fit the page size, then you can scroll to see additional members on the page. |
Data labels |
In graph settings, check or clear the Enable Data Labels option. |
Show Totals |
In graph settings, check the Show Graph Total option to include a bar showing passing and failing percent for all members of the By. |

 at the bottom of the widget to go to additional pages.