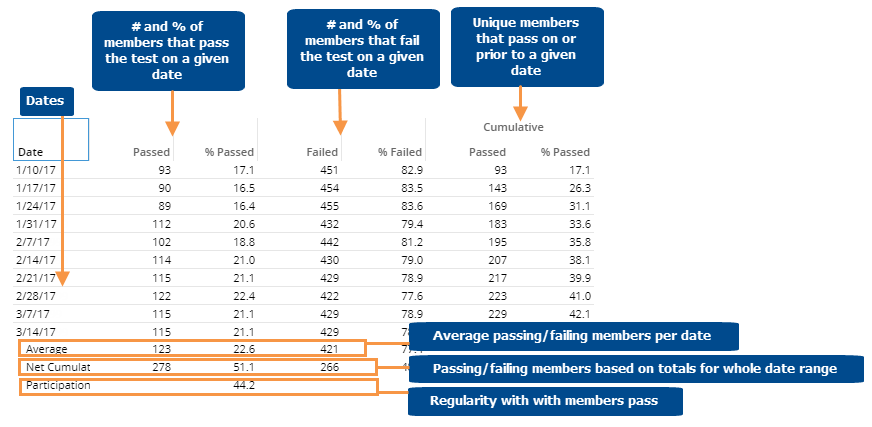
This grid shows the number and percent of passing/failing key members (e.g., customers) for each date in the date range.
Exception Time Series grid options |
Explanation |
Open Exception for date |
You can double-click on a date to open a comparative Exception widget for that date. For this option to be available in view mode, the "allow spawning" option must be on in dashboard settings. |
In grid settings (in explore mode): Swapped and scorecard formats |
The standard grid shows measures in columns. You can switch to a different type (e.g., swapped columns/rows or scorecard) under grid settings. |