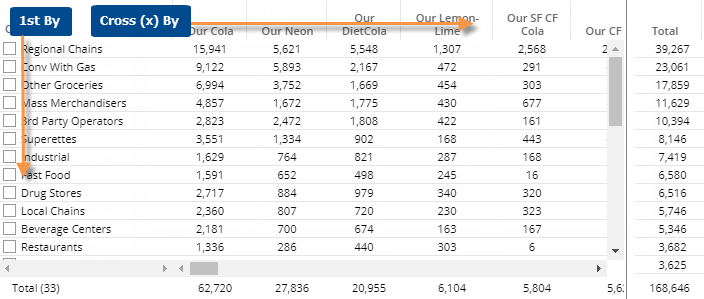
Tip: The selected sort method affects the order of members of the 1st By and Cross By.
Crosstab grid options |
Explanation |
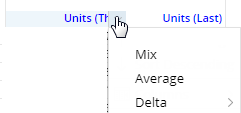
Difference, Percent Change, and Mix columns (in comparisons of two date ranges) |
You can insert
these columns by placing your cursor over a heading, clicking
the drop-down arrow, and selecting the column to add. |
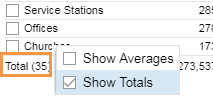
Total and average rows |
To show or hide a total row and/or average row, click on the Total/Average row in the grid. These rows show totals or averages for all members in the context—not just the current page.
|
Highlight data |
In explore mode, you can highlight data in the grid. To access highlight settings, place your cursor over a column heading, click the drop-down arrow, and select Highlighting from the menu. |
In settings (in explore mode): |
|
Grid page size |
In grid settings, you can choose how many members of each dimension to show at once. For the 1st By, this setting controls the maximum number of members on each page. For expanded data (e.g., 2nd By), members over this number will be truncated. Because an expanded grid includes multiple dimensions, the total number of rows may exceed the grid page size. The Column Page Size in grid settings controls how many members of the Cross By to show on one page. You cannot see members of the Cross By beyond this number. |
Lock Crossby |
In general settings, you can turn on the Lock Crossby setting to prevent users from changing the Cross By in view mode. |